Calabasas Real Estate Market Report 91302
Calabasas Market update for August 2019
Calabasas Market update for August 2019 brought to you by your Calabasas Realtor David Salmanson
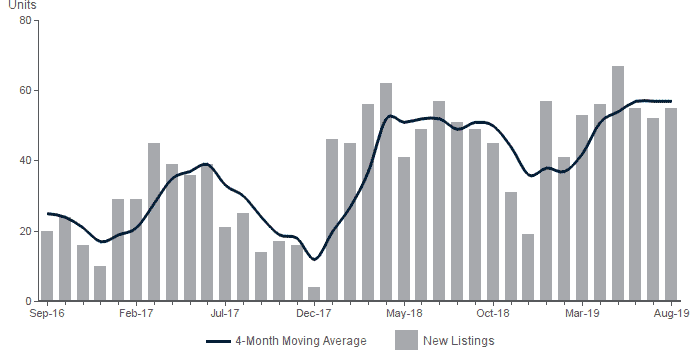
The August 2019 housing market in Calabasas has been pretty steady. There was a 6.67% increase in sold listings since last year, although the median sales price fell by 6.62%. Th average selling price however went up by 5.05%
| MARKET SUMMARY |
| August 2019 | All Property Types |
| Market |
Month to Date |
Year to Date |
| Summary |
August 2019 |
August 2018 |
% Change |
YTD 2019 |
YTD 2018 |
% Change |
| New Listings |
55 |
51 |
7.84%  |
436 |
407 |
7.13%  |
| Sold Listings |
32 |
30 |
6.67%  |
209 |
223 |
-6.28%  |
| Median Listing Price |
$1,424,000 |
$1,525,000 |
-6.62%  |
$1,425,000 |
$1,475,000 |
-3.39%  |
| Median Selling Price |
$1,407,500 |
$1,445,000 |
-2.6%  |
$1,395,000 |
$1,429,000 |
-2.38%  |
| Median Days on Market |
40 |
22 |
81.82%  |
36 |
23 |
56.52%  |
| Average Listing Price |
$2,226,528 |
$2,265,733 |
-1.73%  |
$2,085,149 |
$2,034,233 |
2.5%  |
| Average Selling Price |
$2,148,656 |
$2,045,316 |
5.05%  |
$2,005,314 |
$1,931,507 |
3.82%  |
| Average Days on Market |
72 |
37 |
94.59%  |
58 |
44 |
31.82%  |
| List/Sell Price Ratio |
98.3% |
95.6% |
2.84%  |
97.7% |
97.5% |
0.21% |
|

Calabasas Real Estate Market Report 91302
Like David Salmanson on facebook


